

How do we document and describe our Surroundings? Maps are a graphical or visual way to document and communicate facts about the (geographic) space. Cartography is the traditional science about making maps. The base information of maps is called (geo)spatial data or geoinformation. They can held more information than just the graphical presentation of maps. And they also can be used in more ways than just the traditional presentation of maps.
You may use geoinformation analytically, textually (e.g. listings of addresses) or visually (e.g. printed maps or online maps). You need to collect, categorize and store them, but these informations get their value when using it.
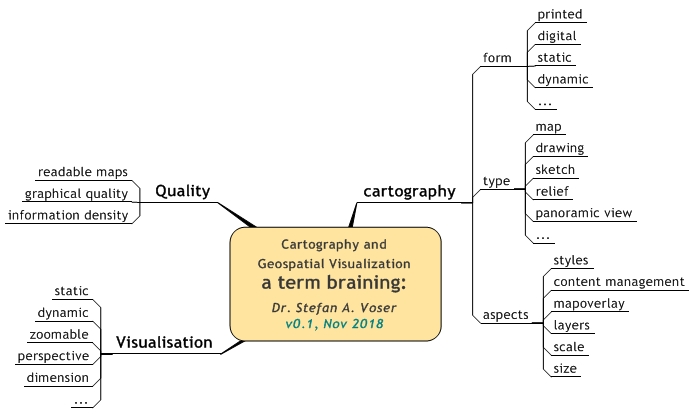
When presenting geoinformation visually, we may use traditional maps (static presentations) and other graphical presentations of geospatial data (usable static and dynamic).
more about maps


A Term Braining
last update: 27.11.18
published: 21.11.18
[to be continued]
more about maps


Add a Comment